This report is a work in progress. The information is derived from historical SPY data. My goal with the report is to have it be a template where you can get all these graphs and data for any ticker calculated automatically, but I’m still working on that functionality.
The S&P 500 is a stock market index comprising the top 500 companies within the United States. SPY is an ETF that tracks a market-cap-weighted index of these top 500 companies and has been around since January 22, 1993.
This report aims to analyze the activity of this fund through the lens of probability. If the S&P were a black box casino, what information would we want to discern from it? What odds and activities could we extract to increase confidence when trading? Tools developed for this report can be used for other stocks as well.
To understand stock movement, we need to utilize a frame of reference. A stock can gain or lose value between open and close, as well as from open to open. However, the 24-hour stock market has only been around for the last decade, and thus this type of analysis can’t be reliably used for every day of the stock since inception. In addition, price movement during “off-hours” trading can be erratic, moving large amounts with relatively low volume. This makes it subject to a much wider gap between the struck value and its actual value. So, our solution is to focus primarily on interday stock prices, measured from the open of one day to the open of the next. This will be done for most statistics presented, except when called out specifically, often in the context of day trading. Lastly, as market conditions change and widespread access to stocks becomes available to retail traders, the movement of stocks evolves as well. It is for this reason that this report examines SPY movement from April 1, 2002, onward.
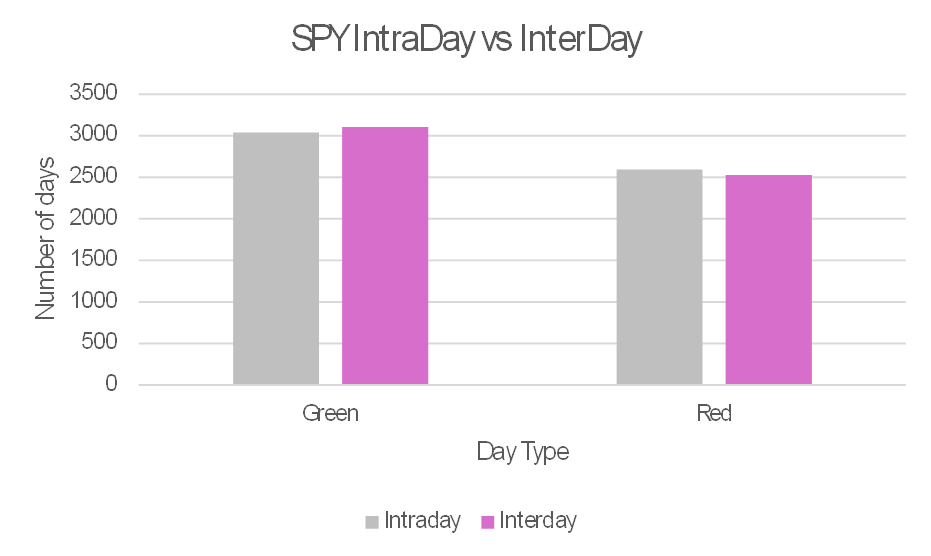
To see the difference between these two modes of reference, see Figure 1. When measured interday, there were more green days and fewer red days.
Figure 1
shows the number of days that were green or red, comparing intraday versus interday measurements. Interday is defined as the stock’s value from open to open, and intraday is defined as open to close. Green versus red simply compares these values, with green indicating the earlier value was lower than the later.
Now we can determine how many days were consecutively green or red. The breakdown is in Table 1. While past performance does not predict future performance, we can establish a trend to help us. If the market has been red for 7 days in a row, it’s certainly possible that it will be red for an 8th day. However, in the last ~5,620 trading days, it has only been red 8 days in a row 3 times, for odds of 1 in ~1,873.
Table 1
shows the breakdown of how many consecutive days were either green or red. Note these days are exclusive, meaning a consecutive streak of four green days does not count as multiple consecutive streaks of two green days. An interesting note is that when this table was put together (August 15, 2024), there were an equal number of single consecutive green and red days.
| Consecutive Days | Consecutive Greens | Consecutive Reds | Consecutive Greens (%) | Consecutive Reds (%) |
|---|---|---|---|---|
| 1 | 1405 | 1405 | 24.94% | 24.94% |
| 2 | 796 | 629 | 14.13% | 11.17% |
| 3 | 427 | 277 | 7.58% | 4.92% |
| 4 | 223 | 128 | 3.96% | 2.27% |
| 5 | 120 | 55 | 2.13% | 0.98% |
| 6 | 64 | 21 | 1.14% | 0.37% |
| 7 | 38 | 8 | 0.67% | 0.14% |
| 8 | 34 | 3 | 0.60% | 0.05% |
| Total | 3107 | 2526 | 55.16% | 44.84% |
With this data, we can make a guess at the “odds” of the next day being red or green based on how many days have ended red or green. These odds can be seen in Table 2.
Table 2
shows the breakdown of the chances of a red streak continuing based on past performance.
| Times Red | Chances of Next Day Being Red | Chances of Next Day Being Green |
|---|---|---|
| 0 | 44.84% | 55.16% |
| 1 | 19.90% | 80.10% |
| 2 | 8.73% | 91.27% |
| 3 | 3.82% | 96.18% |
| 4 | 1.54% | 98.46% |
| 5 | 0.57% | 99.43% |
| 6 | 0.20% | 99.80% |
| 7 | 0.05% | 99.95% |
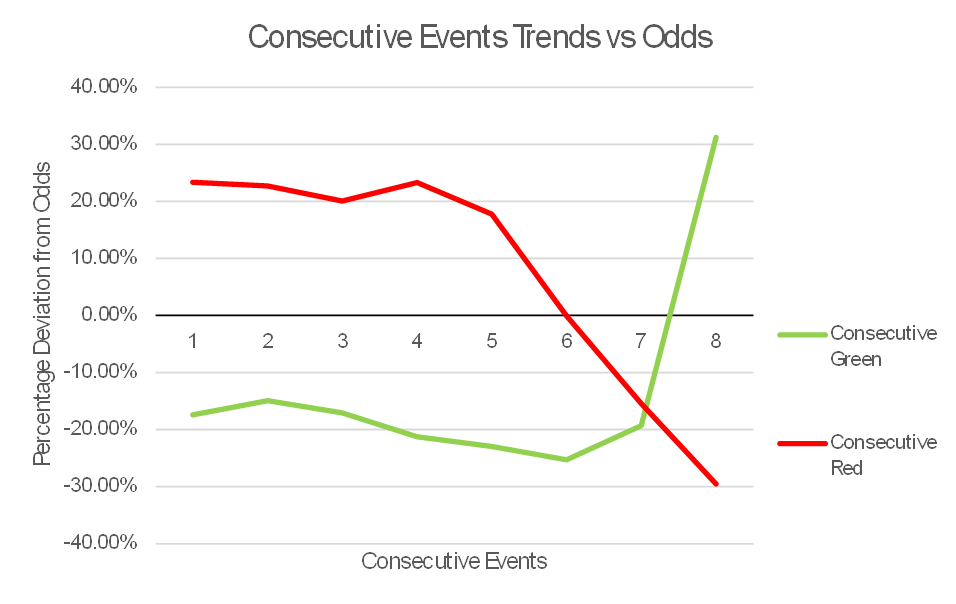
With the data provided, we can see there might be a tendency for consecutive days to have similar outcomes. It becomes important to compare how often these consecutive trends occur in the system compared to what would occur by random chance. If we count the number of red and green days and divide them by the total number of trading days, we get a ratio of 55:45, or 11:9, as derived from the totals in Table 1. To compare this trend to what we see, we can simulate a coin that has an 11:9 weighting for heads and tails. If we flip it 5,633 times (number of trading days), we will get a number of streaks of red and green. This can be compared to the actual number of streaks to determine if the streaks are just results of chance or if there is an outside factor that influences the generation of streaks. The results have been graphed in Figure 2.
Figure 2
shows a graph of the deviation from projected odds of red and green streaks, using base odds of 55% to 45% derived from the proportion of red and green days in SPY. This was compared against actual occurrences of these streaks. This graph shows that, for up to 5 consecutive days, green streaks happen on average 18.7% less often, while red streaks happen on average 21.4% more often. Consecutive streaks of 6, 7, and 8 have a very small sample size and are thus more likely to be inaccurate.
Appendix
Table 1
, the opposite of Table 2, shows the odds of the next day being green.
| Times Green | Chances of Next Day Being Green | Chances of Next Day Being Red |
|---|---|---|
| 0 | 55.16% | 44.84% |
| 1 | 30.21% | 69.79% |
| 2 | 16.08% | 83.92% |
| 3 | 8.50% | 91.50% |
| 4 | 4.54% | 95.46% |
| 5 | 2.41% | 97.59% |
| 6 | 1.28% | 98.72% |
| 7 | 0.60% | 99.40% |
Table 2
contains the data values for the graph in Figure 2.
| Consecutive | Actual Green | Random Chance | Deviancy |
|---|---|---|---|
| 1 | 1405 | 1702 | -17.43% |
| 2 | 796 | 936 | -14.94% |
| 3 | 427 | 515 | -17.04% |
| 4 | 223 | 283 | -21.23% |
| 5 | 120 | 156 | -22.93% |
| 6 | 64 | 86 | -25.27% |
| 7 | 38 | 47 | -19.32% |
| 8 | 34 | 26 | 31.25% |
| Consecutive | Actual Red | Random Chance | Deviancy |
|---|---|---|---|
| 1 | 1405 | 1139 | 23.35% |
| 2 | 629 | 513 | 22.71% |
| 3 | 277 | 231 | 20.09% |
| 4 | 128 | 104 | 23.32% |
| 5 | 55 | 47 | 17.75% |
| 6 | 21 | 21 | -0.09% |
| 7 | 8 | 9 | -15.42% |
| 8 | 3 | 4 | -29.52% |